Hello. this is my blog post for my project, comparing and contrasting neolithic and paleolithic. this was a fun experience because I found out that I enjoy designing things and I also found a useful website that can potentially help me later on with other projects. the website is call canva, and you can see my work down below.
Category Archives: Grade 9
Hydrologic Cycle Blog Post
Hi this is my Hydrologic Cycle poster. I talked about the 3 stages of the water cycle. The 1st stage is evaporation. The 2nd is condensation. The third is precipitation.
Stone Age Tool Advertisement Blog Post
Hi this is my Stone Age tool advertisement.
Criteria Ai
For this criteria, i used statistics to persuade my buyers to think the thing is very cheap.
Criteria Aii
This criteria is about knowing and understanding. i included all the advantages u will get with this axe and how it will make life easier. though i did exaggerate some things…
Criteria Ci
My poster looks like a advertisement because I used color to attract the people’s eyes and offer them a good deal.
Criteria Cii
My poster is organized and the words are big so people won’t have a hard time looking. i made both the picture and the words stand out.
Onigiri Day Blog Post Report
Materials
salt
rice
seaweed
mayonnaise
salt
tuna or salmon
Steps
1. take some rice and put it in a plastic wrapper
2. shape it into a flat circle
3 put the ingredients inside and fold the rice in half
4. shape it into a triangle
5. put the seaweed over it
6. eat
Summary
the fun part about was making the onigiri. it was a fun experience.
Conclusion
this was a very fun and interesting lesson. if we were to do this again, i think we should try a different type of fish and i think more ingredients should be added
Math Unit 1, Data and Statistics Reflection
Self Management skills
I am good at using my time wisely. But I need to improve on keeping track of my homework. To help my self with that, I can write down all my homework and check them after i’m finished.Thinking Skills
Thinking Skills
I’m good at thinking outside the box. I think about the least obvious answers, But I need to work on math puzzles like word problems.
Communication Skills
I rarely use this skill. I almost never take notes. I can improve by sleeping earlier so I will have more energy during the day
Learner Profiles
I am a thinker. I use the most creative ways to solve a problem. I am not a risk taker. I don’t like to raise my hands and share my ideas. I am not principled because i’m not responsible nor organized.
My Candy Lab Report
This is my Candy Lab Experiment. I compared the 3 gummy bear flavors, lemon, apple, and raspberry to see if a gummy bear’s flavor affect how fast it dissolves. the lemon dissolved the fastest. i think the lemon dissolved the fastest because it’s ph level is the lowest, which means it’s more acidic, so it will dissolve faster than the other gummy bears. the apple came in second. the reason apple came second is because it’s the second most acidic. the raspberry came last because it’s the least acidic.
We also gave a presentation about our experiment that we designed. Below is my presentations
Science Unit 1, Think Like a Scientist Reflection
Statement of Inquiry
Scientist think methodically using the scientific method to help them make connections and search for patterns or evidence, which in turn, assists them in solving problems more efficiently.
Self Management skills
I am good at not distracting others but I need to work on staying on task and finishing my work in time.
Communication Skills
I need to work on this skill. especially keeping my notebook organized and up to date.
Social Skills
I’m good at working in groups but I don’t like being the group leader. I can improve by taking responsibility for my own actions.
Learner Profiles
I’m a inquirer because I search whatever I don’t know. But I need to work on being a risk taker. I don’t often raise my hand and talk. I am kind of a communicator because I use some scientific vocabulary but not a lot.
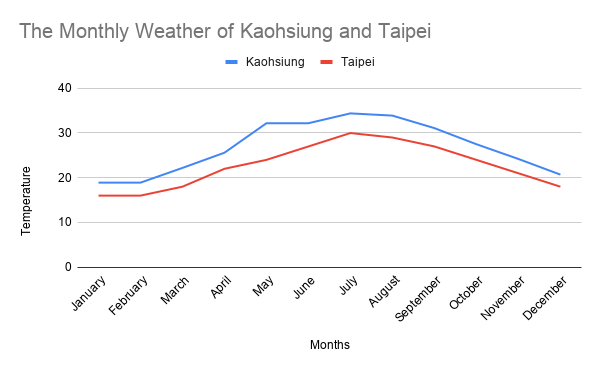
Making Digital Graphs
In math class we studied about data and statistics. Our statement of inquiry was, “The way in which we collect, represent and interpret data, helps us identify patterns, understand relationships and solve real world problems.” Today we practiced making graphs with Google Sheets. Below you can see my graph about Kaohsiung and Taipei average yearly weather.
Hello world!
Welcome to your brand new blog at Share@KAS.\n \n To get started, simply log in, edit or delete this post and check out all the other options available to you.\n \n For assistance, visit Edublogs comprehensive support site, check out Edublogs User Guide guide or stop by The Edublogs Forums to chat with other edubloggers.\n \n You can also subscribe to our brilliant free publication, The Edublogger, which is jammed with helpful tips, ideas and more.\n